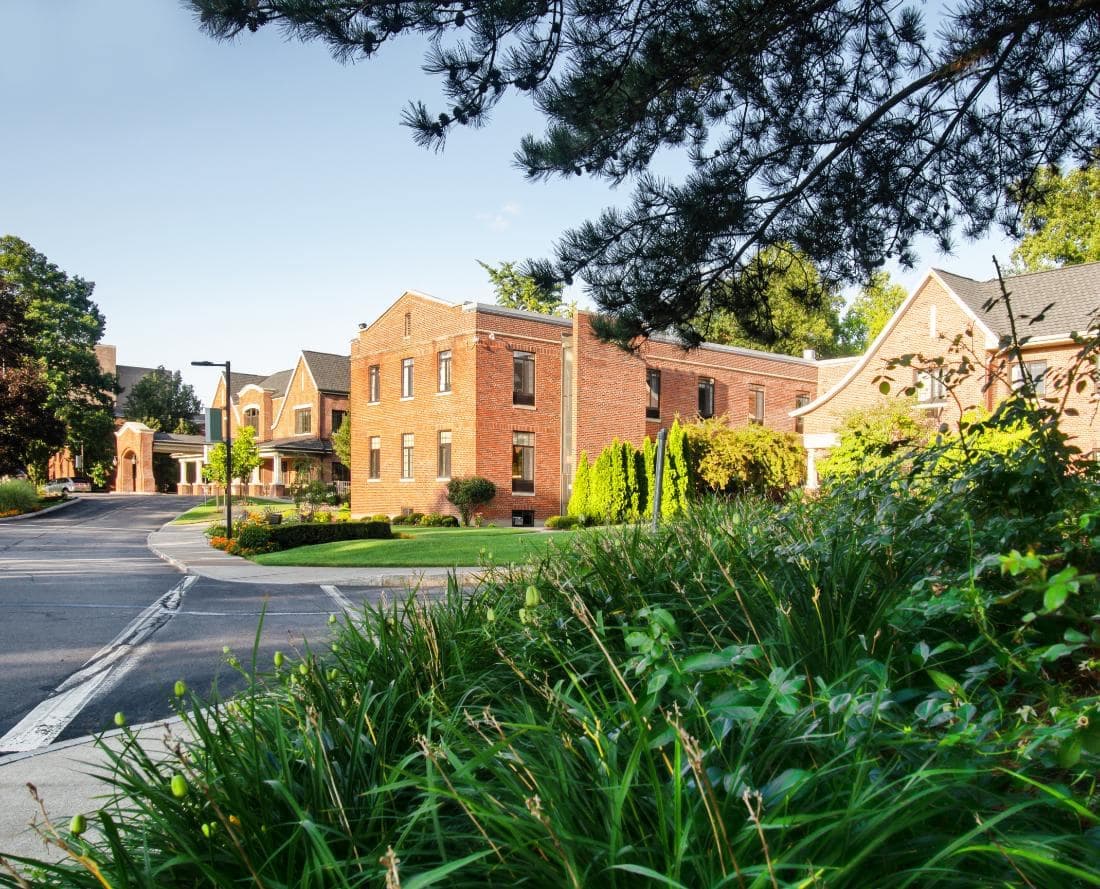
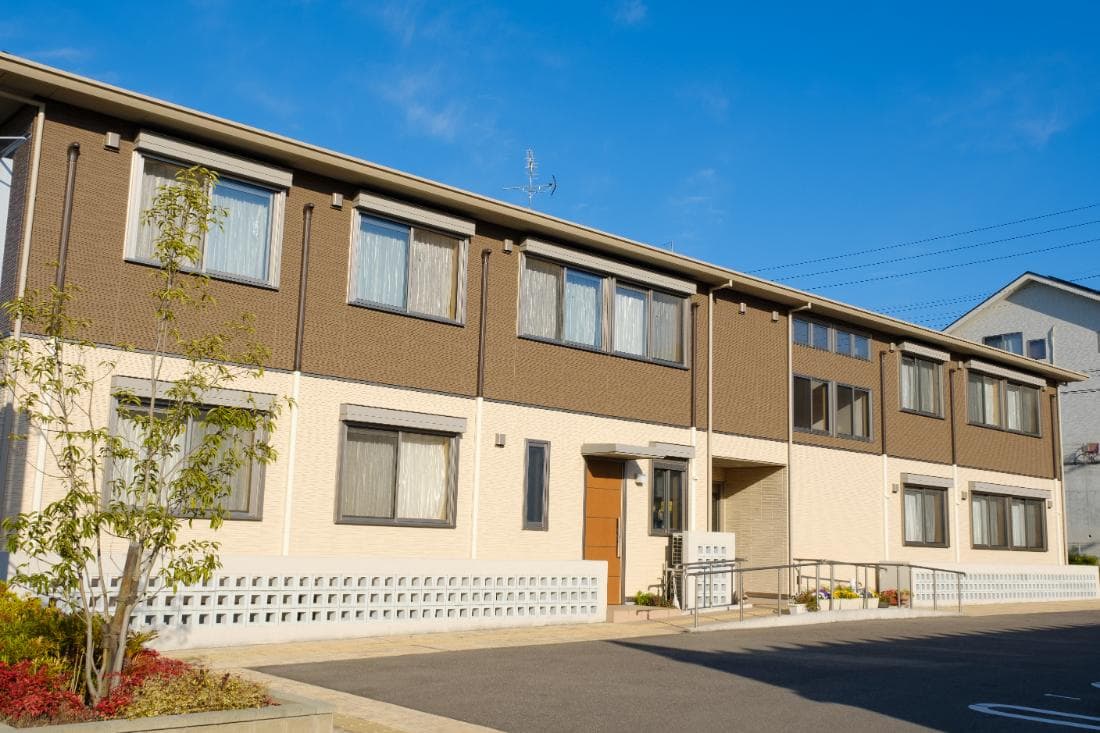
Best Assisted Living Facilities in Dover, DE
Find local assisted living and retirement communities in the Dover, DE area.
The average monthly cost of assisted living is $6,051 in Dover, and there are a variety of senior living options to meet the needs of the city's older residents. Whether you're looking for independent living, assisted living, nursing homes, or memory care, you can rest easy knowing there are 9 different facilities available that cater to your needs. In this guide, we'll take a closer look at the best assisted living options, so you can find the right community for your loved one.
- Adult Day Services
- Assisted Living
- Home Care
- Independent Living
- Memory Care
- Nursing Home
- Residential Care Home
- Respite Care
- Senior Apartments
- Distance from City Center
- Highest Rating
- Name: A - Z
- Name: Z - A

Senior Helpers - Dover, DE
9 East Loockerman Street Suite 3B, Dover, DE 19901 (0.1 mi from city center)Senior Helpers provides in-home senior care services in Dover, DE.

State Street Assisted Living
21 N State Street, Dover, DE 19901 (0.3 mi from city center)State Street Assisted Living is a community that provides personalized assistance and quality living for seniors, offering private and semi-private apartments, a full program of activities, and various amenities.
Home Instead
30 American Ave, Dover, DE 19901 (0.4 mi from city center)Home Instead in Dover, DE provides personalized in-home senior care services including companionship, personal care, and specialized memory care.

Harmony at Kent
1435 E Lebanon Rd, Dover, DE 19901 (1 mi from city center)Harmony at Kent is a senior living community offering independent living, assisted living, and memory care in Dover, Delaware.
Vicdania Health Services
1019 S Governors Ave, Dover, DE 19904 (1.3 mi from city center)Vicdania Health Services provides skilled medical home healthcare and non-medical home care services for adult and pediatric patients at home in Dover, Delaware area.
Brookdale Dover
150 Saulsbury Road, Dover, DE 19904 (1.4 mi from city center)Brookdale Dover offers assisted living and memory care services in a supportive and well-rounded lifestyle environment.

Silver Lake Center
1080 Silver Lake Blvd, Dover, DE 19904 (1.6 mi from city center)Complete Care at Silver Lake is a skilled nursing facility offering intermediate care, long-term care, and subacute rehab services.

Dover Place
1203 Walker Rd, Dover, DE 19904 (1.9 mi from city center)Dover Place is an Assisted Living community that offers Memory Care and personalized attention in a vibrant community setting.

Cadia Healthcare Capitol Healthcare
1225 Walker Rd, Dover, DE 19904 (1.9 mi from city center)Cadia Healthcare Capitol is a skilled nursing facility offering rehabilitation, long-term care, and memory care services.
Map of Assisted Living in Dover
Find the right senior living community by location- Senior Helpers - Dover, DE
- State Street Assisted Living
- Home Instead
- Harmony at Kent
- Vicdania Health Services
- Brookdale Dover
- Silver Lake Center
- Dover Place
- Cadia Healthcare Capitol Healthcare
Senior Living Statistics for Dover, Delaware
Average Senior Living Costs by Housing Type
| Housing Type | Average Monthly Cost |
|---|---|
| Assisted Living | $6,051 |
| Memory Care | $6,051 |
| Independent Living | $5,021 |
| Nursing Home: Private Room | $6,603 |
| Nursing Home: Semi-Private Room | $5,475 |
| Nursing Home: Studio | $5,765 |
| Nursing Home: One Bedroom | $6,037 |
Average Cost of Assisted Living in Dover
| City | Average Monthly Cost |
|---|---|
| Dover | $6,051 |
| Townsend | $5,227 |
| Hartly | $5,413 |
Here is how the average cost of assisted living in Dover compares to Delaware and the national average:
| Area | Average Monthly Cost |
|---|---|
| Dover | $6,051 |
| Delaware | $5,736 |
| United States | $4,546 |
Senior Living Availability in Dover
Dover
Surrounding Area
Delaware
Dover Senior Demographics
Population
Dover has a population of 39,491.- 45.4% Male
- 54.6% Female
Marital Status
- 33.4% Married
- 14.8% Divorced
- 45.2% Never Married
- 6.6% Widowed
Age
Seniors make up about 32.2% of the population.- 9.8% in their 50s
- 9.3% in their 60s
- 7% in their 70s
- 6.1% in their 80s
Diversity
- 37.3% White
- 45.2% Black
- 2.8% Asian
- 0.3% Native
- 0.1% Pacific
- 3.8% Identifying as Other
- 10.5% Mixed Race
- 11.3% Hispanic
Senior Living Ratings Methodology
Our experts spent over 50 hours researching the best communities in each city, focusing on these key factors.

Available Care
We value communities that offer more than standard living services, such as memory care and independent living. We think this is beneficial for older adults, as it allows a community to meet your changing needs over time.
Amenities
Amenities can help an assisted living community feel like a luxury resort or a home away from home. Our research focuses on communities that offer extra perks and benefits for seniors to enjoy.
Location
Location can be important. Since many seniors like to have certain comforts nearby, we look at communities close to parks, shopping areas, hospitals, museums, and other practical or entertaining points of interest.
Reviews
We read through dozens of reviews for every single contender and include a summary of our findings. In most cases, we see common themes regarding positive and negative feedback about each community. Just remember not to take individual reviews at face value.
Cost
Assisted living costs vary greatly based on the facility and level of care. We considered communities that are suitable for various budgets and offer solid value. All prices listed are from community websites.